
Question: Look at the chart below. It shows the monthly expenditure of a family. Describe and analyze the chart.
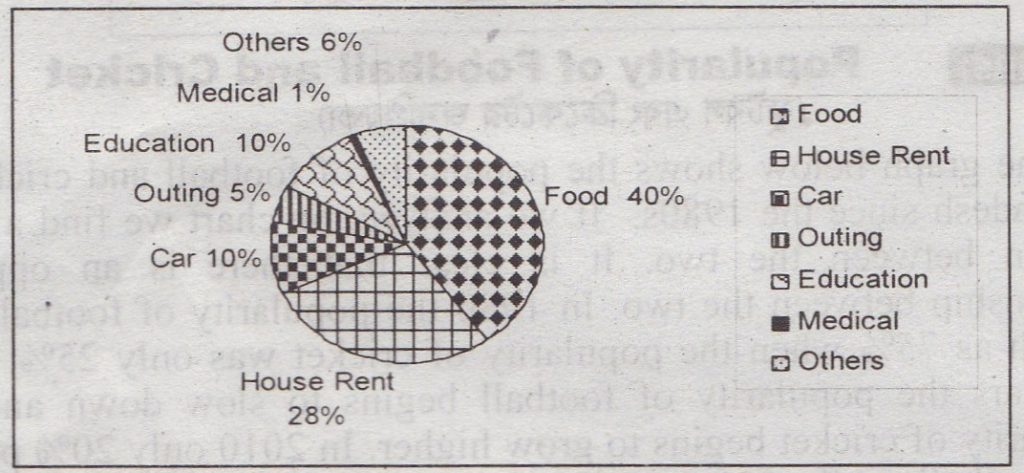
A Family Expenditure
Answer: The chart shows the monthly expenditure of a family. From the chart it is clear that the family’s highest portion of monthly expenditure goes for food and it is 40% of the total expenditure. The family spends 28% for house rent. Thus it is seen that nearly three-fourths of the total expenditure, that is (40+28=) 68% goes for food and house rent. The family has a private car and 10% of the total expenditure goes for maintaining the car. The same portion that is 10% is spent on education. The family goes for an outing each month and for this, it spends 5% of its total expenditure. For medical purposes, the family spends 1%. Apart from these specific expenses, the family has some other expenditure that has been shown as ‘others’. For ‘others’ the family spends 6% of its total monthly expenditure.