
Question: The chart below shows the results of Swadhin in his Term-End exam. Now, describe the chart in 120 words.
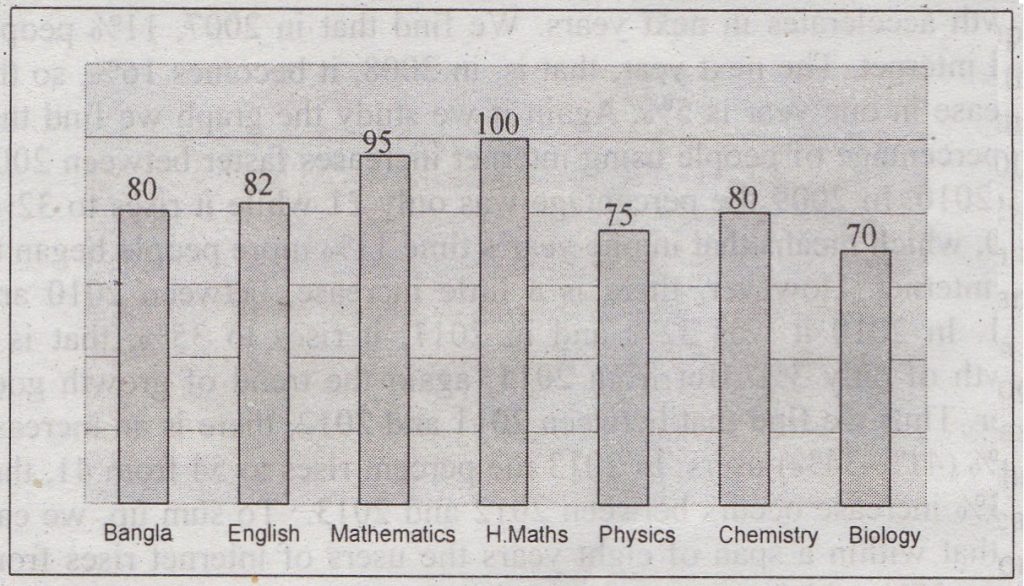
Swadhin’s Term-End Exam Result
Answer: The chart shows Swadhin’s Term-End exam result in seven subjects. These subjects are Bangla, English, Mathematics, Higher Mathematics, Physics, Chemistry, and Biology. The graph shows that Swadhin gets the highest marks, that is 100 out of 100 in Higher Mathematics. The second highest is his marks in Mathematics and it is 95. Swadhin gets same marks in Bangla and Chemistry and that is 80 in each. Swadhin gets 82 marks in English. The graph also shows that Swadhin gets the lowest marks in Biology and it is 70. He gets 75 marks in Physics. However, we also can observe Swadhin’s marks considering the nature of subjects. To compare Bangla and English we see that Swadhin gets 2 marks more in English. Between Mathematics and Higher Mathematics, he gets 5 marks more in Higher Maths. Again, between Physics and Chemistry, he does better in Chemistry. At a glance, the graph shows that Swadhin gets A+ (80 and above) in five subjects and he gets. A (70-79) in two subjects. Thus, Swadhin’s marks in the above seven subjects have clearly been shown in the graph.