
Question: The graph below shows ‘total candidates in SSC Examination-2013‘. Describe the graph in 150 words. You should highlight and summarize the information given in the graph.
Total Candidates in S.S.C Examination-2013
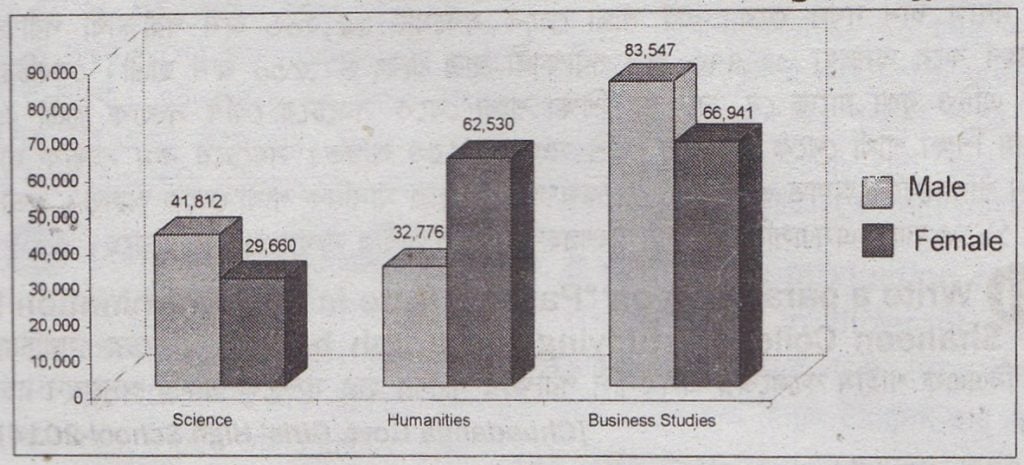
Answer: The graph shows the number of male and female students sitting for the S.S.0 examination in the year 2013 from three different groups Science, Humanities and Business Studies. At first glance, the chart shows that the highest number of candidates are from Business Studies group, and the lowest number of candidates are from Science group. From Business Studies a total of 1,50,488 candidates sit for the exam out of which 83,547 candidates are males and 66,941 are females. This is the highest number of boys and girls compared to the other two groups. The lowest number of boys and girls sitting for the exam are from the Science Group. Here the males are 41,812 and the females are 29,660. Clearly, in a number of candidates, Humanities Group occupies the mid position. From this group, a total of 95206 candidates sit for the exam out of which 32,776 are male candidates and 62,530 are the females. From the chart, it is also clear that the highest number of female students are from the Business Studies group, and the highest number of male students are also from Business Studies Group. The lowest number of female students are from Science Group, and the lowest number of male students are from Humanities Group. Thus, the chart has shown the number of male and female candidates sitting for the SSC exam in 1913.