
Question: The graph below shows the results of SSC examination of ABC Secondary School from 2008 to 2012. Describe the graph in 150 words. You should highlight and summarise the information given in the graph.
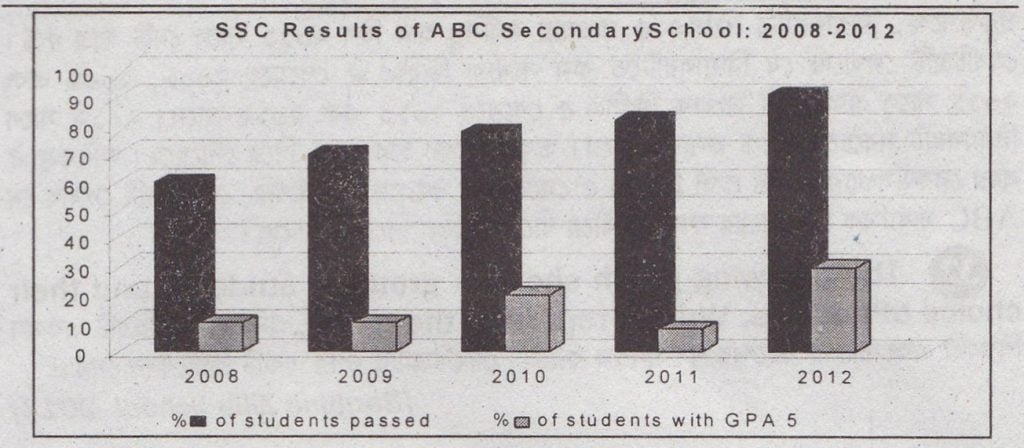
Results of SSC Examination in ABC School
Answer: The graph shows the results of SSC examinations of ABC Secondary School from 2008 to 2012. In general, the graph shows a gradual improvement of the SSC candidate’s performance within this time. It is seen from the graph that the rate of passing rises significantly over time. In 2008, the rate of passing is 58%, in 2009 it is increased to 68%, in 2010 it is 75%, in 2011 it is 80% and in 2012 it is 90%. So, from 2008 to 2012, there is a significant increase in the rate of passing. The graph also shows an increase of candidates who passed with GPA 5. According to the graph the number of GPA holders in 2008 is only 8 while in 2012 this number turns 28. However, the school had the lowest rate of GPA 5 holders in 2011, which was only 7%. The performances of the SSC candidates were. almost similar in 2009 and 2010, with slightly better results in 2010. The school recorded the best results in 2012 when the pass rate went as high as 90%. Moreover, a record of 32% candidates passed with a GPA 5 in this year. Overall, the graph illustrates that the SSC results of ABC Secondary School improve steadily.