Question: Look at the following chart. It shows the expenses of Mr. Orko to leads his family.

Chart of The Expenses of a Man to Leads His Family
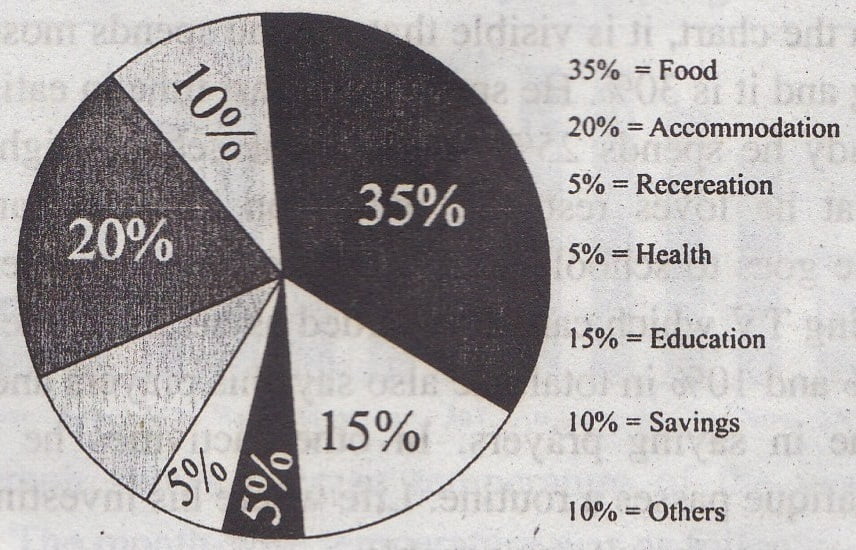
Answer: The table provides information about how Mr. Orko leads his family. The table shows that he spends money mainly in six areas Food, Accommodation, Recreation, Health, Education, Savings, others. He spends the highest money on food which is 35%. The second highest is spent on accommodation and it is 20%. Children’s education goes the third high and it is 15%. He spends 10% on others and it is the fourth in the position of his costing. 5% spent both for recreation and health which is the lowest cost. Moreover, he saves 10% and it proves that he is intelligent enough because he thinks about the future.
Similar Posts:
- Describe and Analyze the Chart of The Monthly Expenditure of a Family
- Describing the Pie Chart of The Percentage of a Family Expenditure
- Describe the Pie-Chart of The Amount of Time That A Person Spends Each Day on Various Activities
- Describing the Graph of Daily Activities
- Describing the Pie Chart of The Percentage of Types of Transportation Used By Students
- Describe and Analyze the Chart of the Export Sectors in Bangladesh That Earn Foreign Money
- Describing the Pie Chart of The Passing Rates of Different Subjects of a School
- Describing the Pie Chart of The Benefits of Girls Education
- Describe and Analyze the Graph of The Number of Unemployed Youths in A District of Bangladesh
- Describing the Pie Chart of of The Interest of The Students in Different Subjects