Question: This is the results of Eshan’s final examination. Now describe the chart in 120 words.

Final Examination Results Chart
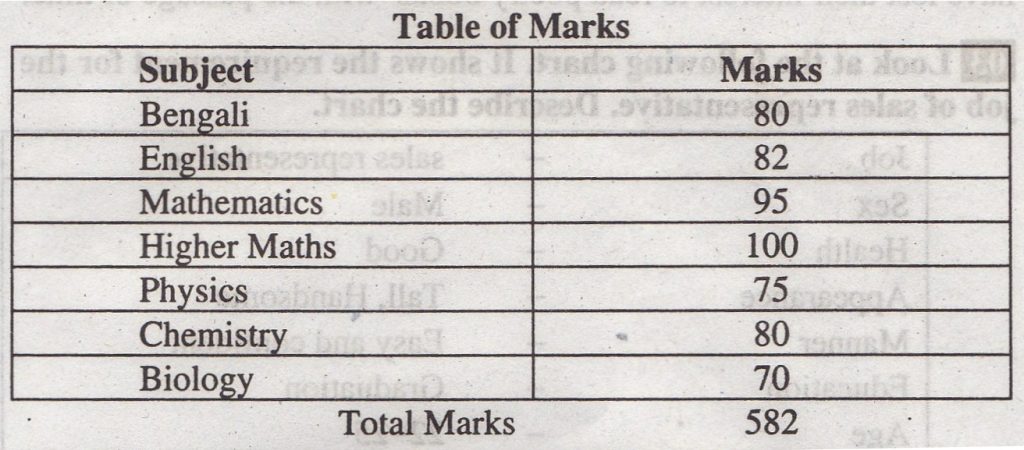
Answer: This graph shows Eshan’s scores in his term-end exam in seven specific subjects— Bengali, English, Mathematics, H. Maths, Physics, Chemistry and Biology. He has secured 80 in Bengali, 82 in English 95 in Mathematics, 100 in H. Maths, 75 in Physics, 80 in Chemistry and 70 in Biology. He got the highest score as 100 in H. Maths and the lowest score in Biology. He got the same marks in Bengali and Chemistry. The graph shows that Eshan is good at H. Math, Mathematics, English, Bengali and Chemistry. But he is weak in Biology and Physics.
Similar Posts:
- Describing the Chart of The Term-End Exam Result
- Describing the Pie Chart of The Passing Rates of Different Subjects of a School
- Describing the Pie Chart of of The Interest of The Students in Different Subjects
- Describe and Summarize the Chart of Passing Rate of Different Subjects in A Class in First Term Exam
- Describing the Graph of The Results of SSC Examination of a Secondary School
- Describing the Graph of The Total Candidates in S.S.C Examination
- Describing the Graph of The Passing Rate in SSC Examination in BAF Shaheen College
- Letter on How You Have Prepared for The Coming Year S.S.C Examination
- Describing the Graph of The Importance and Usage of English
- Describing the Graph of The Arrival of Tourists from Different Countries