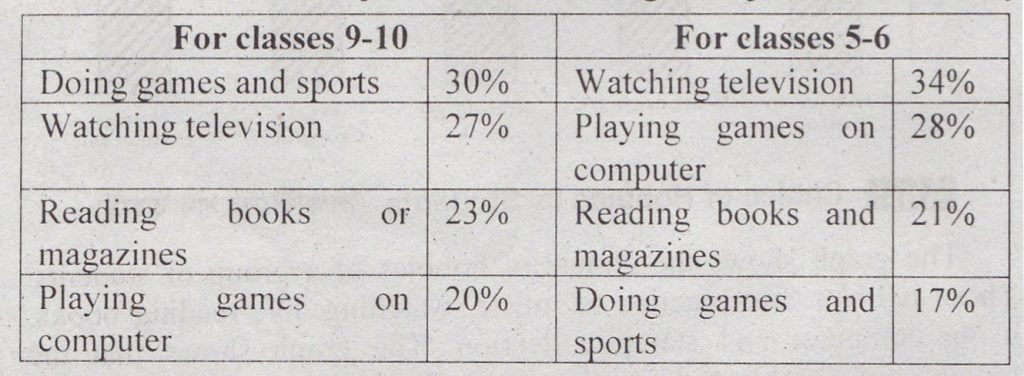
Question: Look at the Chart below. It shows the pastimes of the students of classes 9-10 and classes 5-6. Describe the chart in 150 words. You should highlight and summaries the information given in the chart.

Pastimes of the Students
Answer: The chart shows the pastime activities of the students in classes 9-10 and classes 5-6. Both the groups of students pass their leisure in some activities. These activities are: watching television, playing games on the computer, reading books and magazines, and doing games and sports. However, there are variations in preferences of choice of the students. The highest percentage of students of classes 9-10 (30%) like to spend their free time playing games and sports while the same activity is chosen by the lowest percentage of students of classes 5-6 (17%). Again, the majority of classes 5-6 students (34%) want to pass their time in watching television while less percentage of students of classes 9-10 (27%) spend their leisure in this activity. As regards reading books and magazines the percentage of students from both the groups are very close. It is 23% with the students of classes 9-10 and 21% with the students of classes 5-6. The lowest percentage of students in classes 9-10 (20%) like to play games on the computer while the same activity is liked by 28% of students in classes 5-6. Thus, significant variations of choice are noticeable in the same pastime activities between the two groups of students.

