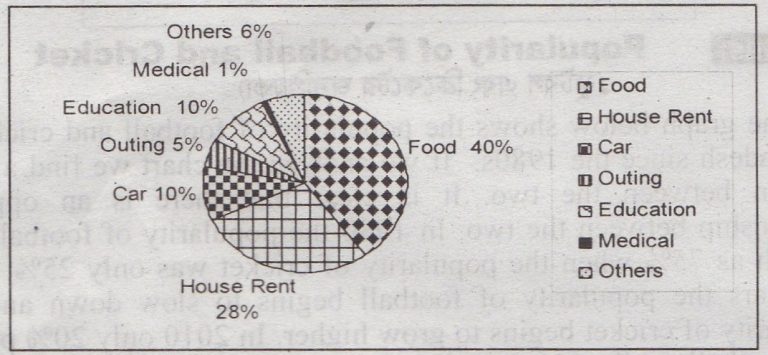
Question: Look at the chart below. It shows the monthly expenditure of a family. Describe and analyze the chart. A Family Expenditure Answer: … [Read more...] about Describe and Analyze the Chart of The Monthly Expenditure of a Family
Graphs and Charts
Describing the Graph of The Reasons for Study
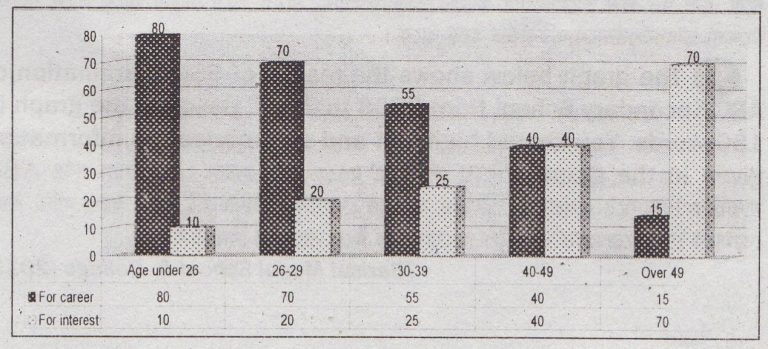
Question: Look at the following graph. It shows the main reasons for the study among students of different age groups. Now, describe the graph in your … [Read more...] about Describing the Graph of The Reasons for Study
Describing the Graph of The Arrival of Tourists from Different Countries
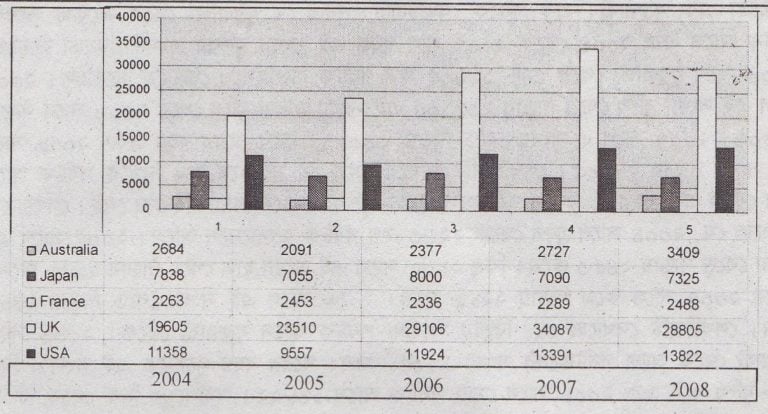
Question: The graph below shows the arrival of tourists from different countries in Bangladesh from 2004 to 2008. Describe the graph in 150 words. You … [Read more...] about Describing the Graph of The Arrival of Tourists from Different Countries
Describing the Pie Chart of The TV Watching Statistics on American Children’s
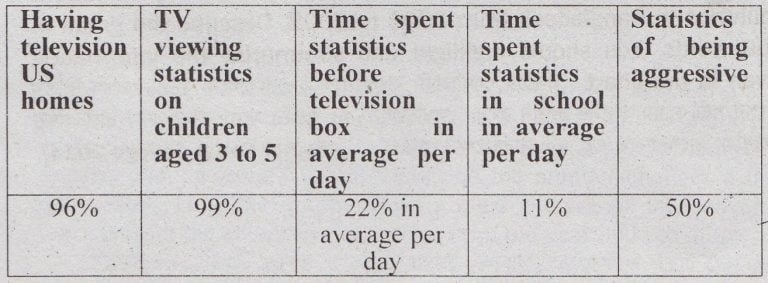
Question: Look at the chart below. It shows the TV watching statistics on American Children's lives. Now, describe the chart in your own … [Read more...] about Describing the Pie Chart of The TV Watching Statistics on American Children’s
Describing the Pie Chart of The Pastimes of The Students
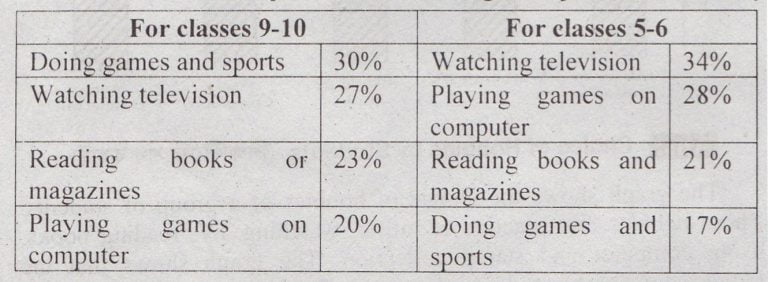
Question: Look at the Chart below. It shows the pastimes of the students of classes 9-10 and classes 5-6. Describe the chart in 150 words. You should … [Read more...] about Describing the Pie Chart of The Pastimes of The Students
Describing the Graph of The Choice of Hobbies by Students
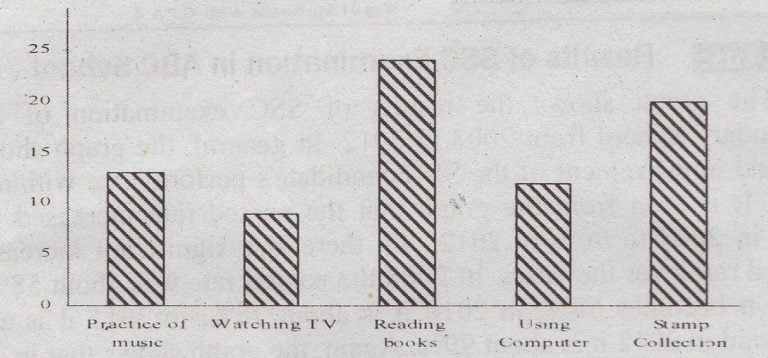
Question: The following graph shows a group of students and their choice of hobbies. Write a report on the graph. Choice of Hobbies by … [Read more...] about Describing the Graph of The Choice of Hobbies by Students
Describing the Graph of The Results of SSC Examination of a Secondary School
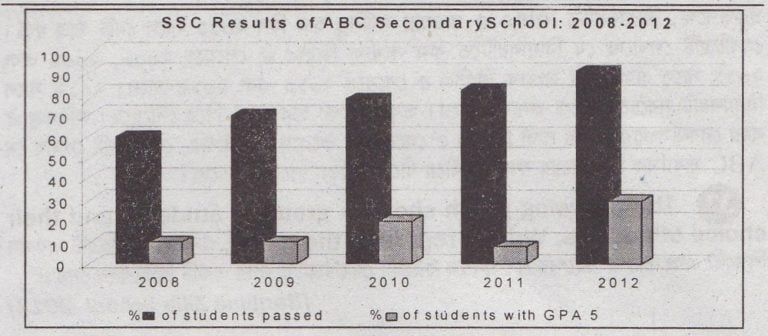
Question: The graph below shows the results of SSC examination of ABC Secondary School from 2008 to 2012. Describe the graph in 150 words. You should … [Read more...] about Describing the Graph of The Results of SSC Examination of a Secondary School
Describing the Pie Chart of The Sources of Air Pollution in A City
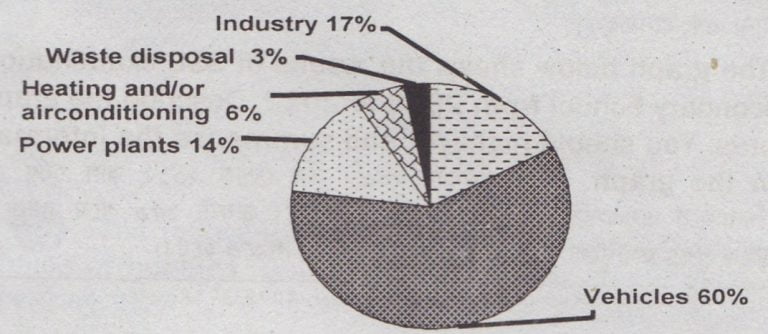
Question: The pie chart below shows the sources of air pollution in a city. Describe the chart in 150 words. You should highlight and summarize the … [Read more...] about Describing the Pie Chart of The Sources of Air Pollution in A City
Describing the Graph of The Young People’s Changing Trends in Pastime Habits
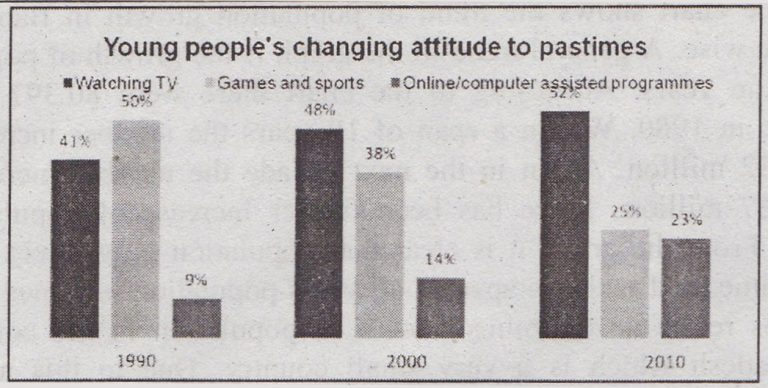
Answer: Study the following graph about the survey of Young People's Changing Attitude to pastimes. Now, write a paragraph describing it: Young … [Read more...] about Describing the Graph of The Young People’s Changing Trends in Pastime Habits
Describing the Graph of The Total Candidates in S.S.C Examination
Question: The graph below shows 'total candidates in SSC Examination-2013'. Describe the graph in 150 words. You should highlight and summarize the … [Read more...] about Describing the Graph of The Total Candidates in S.S.C Examination