
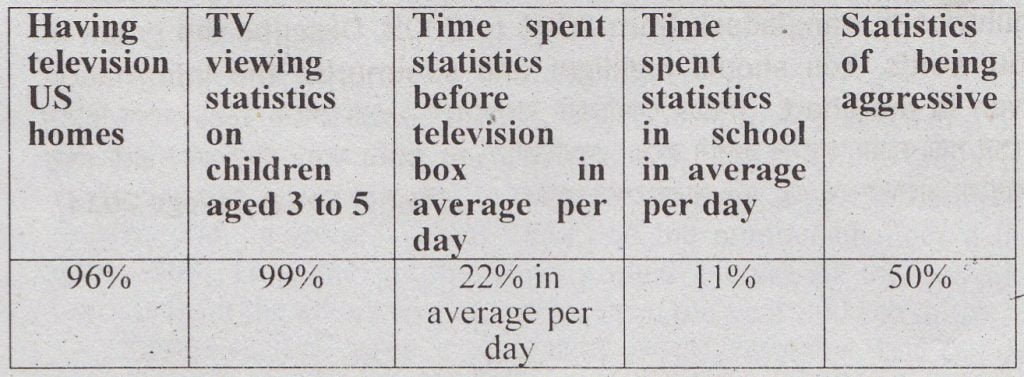
Question: Look at the chart below. It shows the TV watching statistics on American Children’s lives. Now, describe the chart in your own words.
American Children’s Watching TV
Answer: This chart gives an idea about the TV watching statistics in America for the children aged 3 to 5. According to the chart, 96% of US homes have TVs and 99% of children aged 3 to 5 watch television. However, there is a threatening report that children aged 3 to 5 are becoming addicted to television shows. The chart shows that the above age-group children spend double the time of their school hours before the TV set. Statistics show that on an average per day they spend 11% of their time in school whereas they spend 22% time before the television set. This TV viewing statistics for children also have bad effects on children’s body and mind. By watching the films of violence, they turn violent and aggressive in their behavior. The chart shows that 50% of TV watchers of the age group 3 to 5 become aggressive. Thus, from the chart, it is evident that there is some negative influence of TV on the minds of American children.