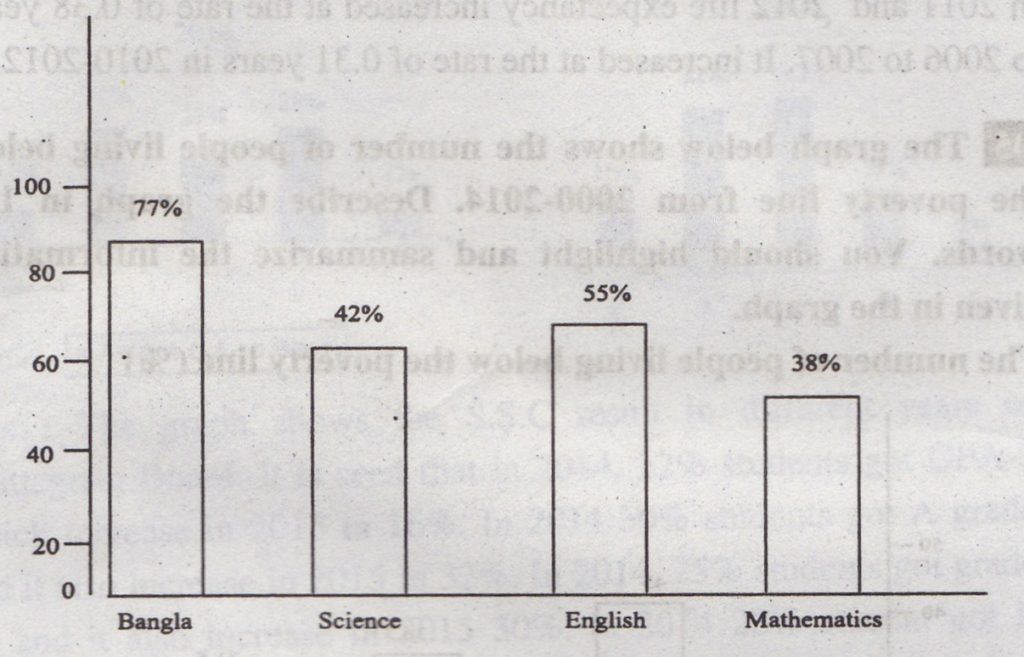
Question: The flow chart shows the passing rate of different subjects in class nine in the first terminal exam of 2012 in Rangpur high school. You should highlight and summarize the information given in the graph.

Answer: The graph shows the passing rate of different subjects in class nine in the first terminal exam. of 2012 in Rangpur high school. It shows that the highest number of students passed in Bangla and it was 77%. The second highest was in English and 55% of students passed on that subject. Only 42% of students passed in science and it was the third-highest in terms of passing rate. The lowest number of students passed in Mathematics and it was only 38%. The chart makes it clear that the student of class nine was very much weak in Mathematics and Science. Almost half of them failed in English. So. they were also weak in English. In Bangla, they were much stronger than other subjects although there was scope for improvement.

