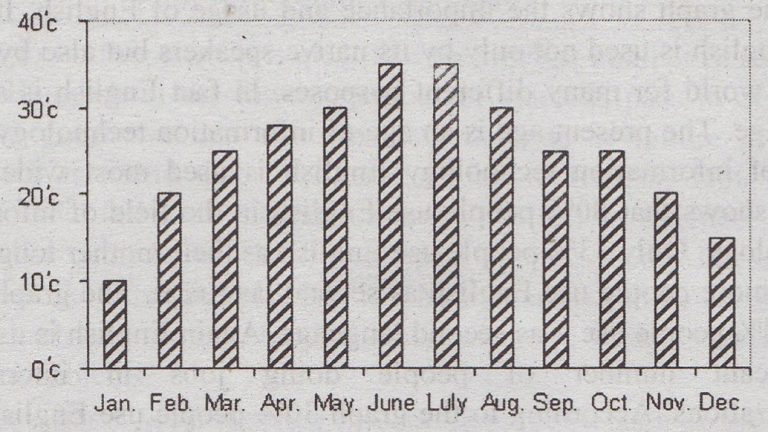
Question: The graph below shows the average temperature of the year 2012 in Bangladesh. Describe the graph in 150 words. You should highlight and … [Read more...] about Describing the Graph of The Average Temperatures of The Year
Graphs and Charts
Describing the Chart of The Trend of Population Growth in Bangladesh
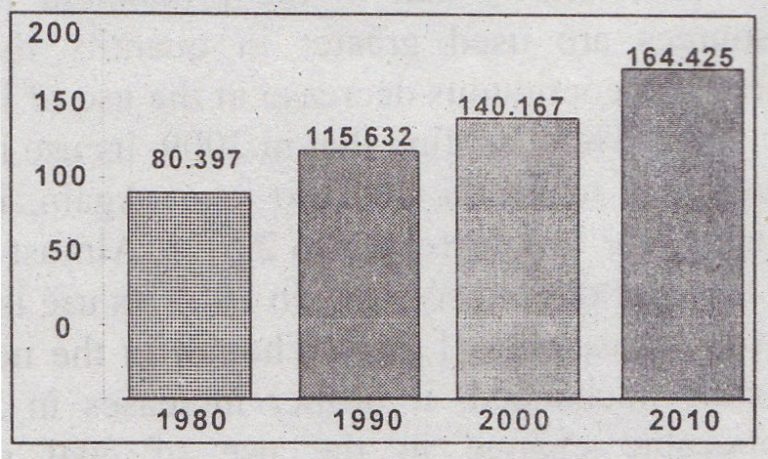
Question: Study the following flow chart on the population growth of the last four decades in millions in Bangladesh and give your personal opinion … [Read more...] about Describing the Chart of The Trend of Population Growth in Bangladesh
Describing the Chart of The Production of Electricity by Coal and Hydroelectric Sources
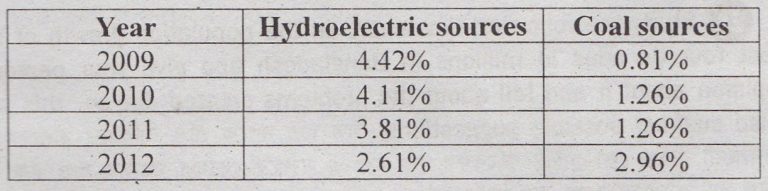
Answer: Look at the following chart. It shows the production rate of electricity from coal and hydroelectric sources in different years. Now, describe … [Read more...] about Describing the Chart of The Production of Electricity by Coal and Hydroelectric Sources
Describing the Graph of The Passing Rate in SSC Examination in BAF Shaheen College
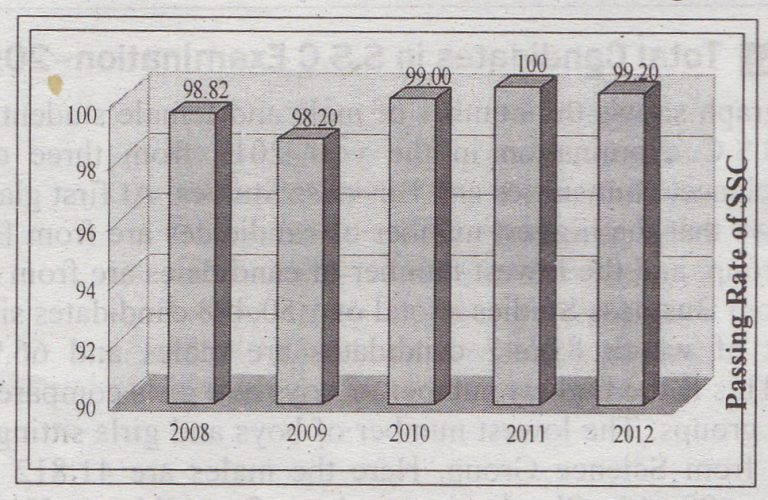
Question: Write a paragraph on "Passing Rate in SSC Examination in BAF Shaheen College" studying the graph below: Passing Rate in SSC Examination … [Read more...] about Describing the Graph of The Passing Rate in SSC Examination in BAF Shaheen College
Describing the Graph of The Importance and Usage of English
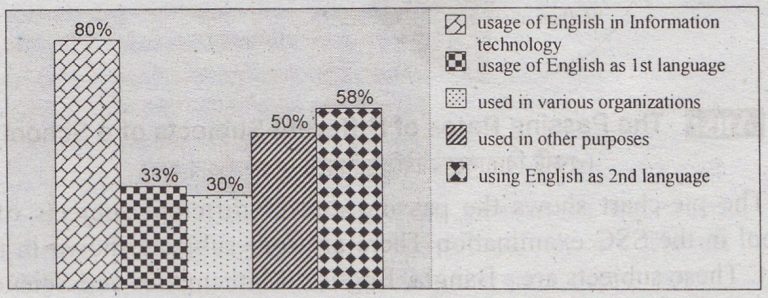
Question: The graph below shows the importance and usage of Describe the chart in 150 words. You should highlight and summarize the information given … [Read more...] about Describing the Graph of The Importance and Usage of English
Describing the Pie Chart of The Passing Rates of Different Subjects of a School
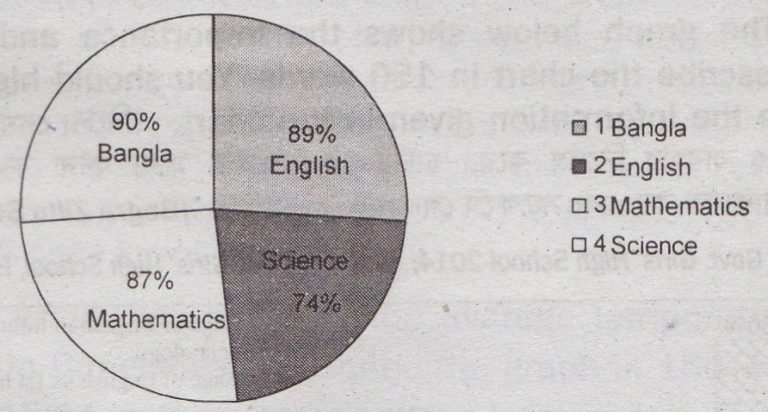
Question: Look at the following pie-chart. It shows "the passing rates of different subjects of a school" in the SSC Examination. Describe the chart … [Read more...] about Describing the Pie Chart of The Passing Rates of Different Subjects of a School
Describing the Chart of The Term-End Exam Result
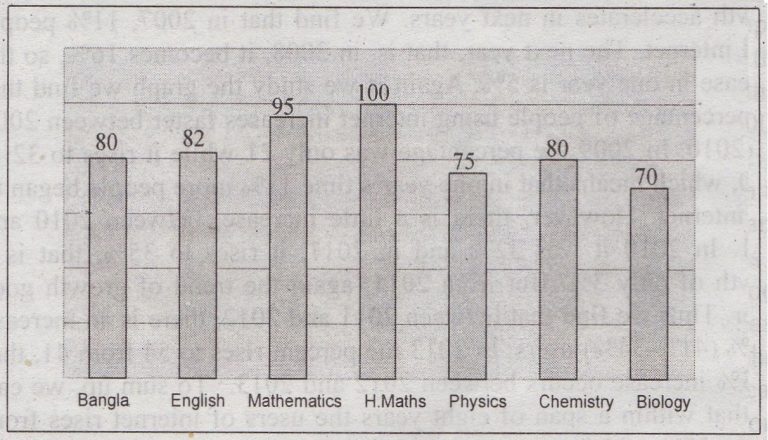
Question: The chart below shows the results of Swadhin in his Term-End exam. Now, describe the chart in 120 words. Swadhin's Term-End Exam … [Read more...] about Describing the Chart of The Term-End Exam Result
Describing the Graph of The Internet Users from 2005 to 2013
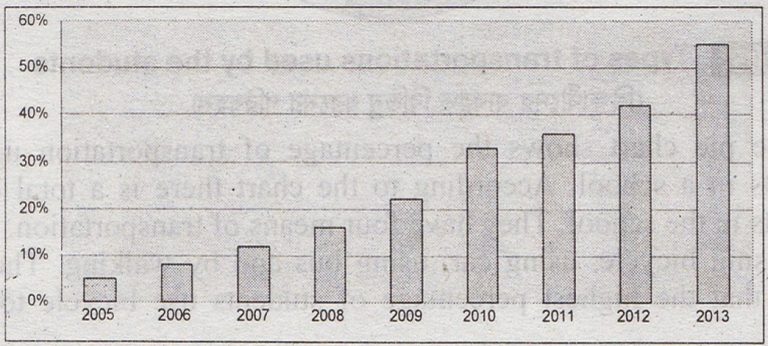
Question: The graph below shows the Internet Users from 2005 to 2013. Describe the graph in 150 words. You should highlight and summaries the … [Read more...] about Describing the Graph of The Internet Users from 2005 to 2013
Describing the Graph of Literacy Rate of Bangladesh from 1995-2010
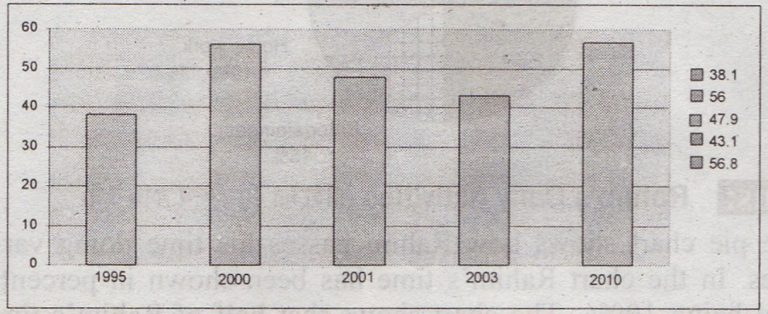
Question: The graph below shows the 'Literacy Rate' of Bangladesh from 1995 to 2010. Describe the graph in 150 words. You should highlight-and … [Read more...] about Describing the Graph of Literacy Rate of Bangladesh from 1995-2010
Describing the Graph of Daily Activities
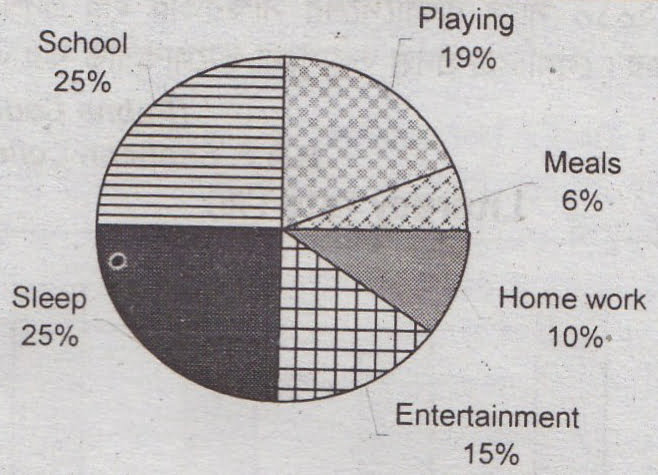
Question: The graph below shows Rahim's time spending on various activities. Describe the chart in 150 words. Rahim's Daily Activities Answer: … [Read more...] about Describing the Graph of Daily Activities