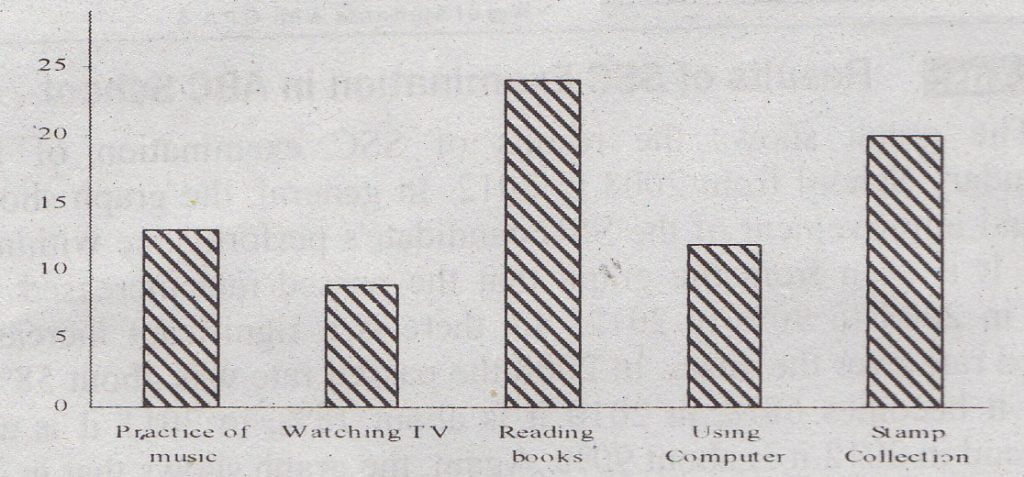
Question: The following graph shows a group of students and their choice of hobbies. Write a report on the graph.

Choice of Hobbies by Students
Answer: The graph shows the choice of hobbies for a group of students. These hobbies are the practice of music, watching TV, reading books, using computer and stamp collection. The graph shows that the highest number of students (here it is 24 students) choose reading books as their hobby. The lowest number of students (here it is 08 students) choose watching TV as their hobby. 22 students like a stamp collection. 14 students like the practice of music, 13 students like using a computer. Therefore. in preference of hobbies, stamp collection is in the second position, practicing music is in the third position and using the computer is in the fourth position. The graph also shows the closeness of choice in the matter of using the computer, practicing music and watching TV. Therefore, according to preference (from highest to the lowest), the hobbies are reading books, stamp collection. practicing music, using a computer and watching TV.

