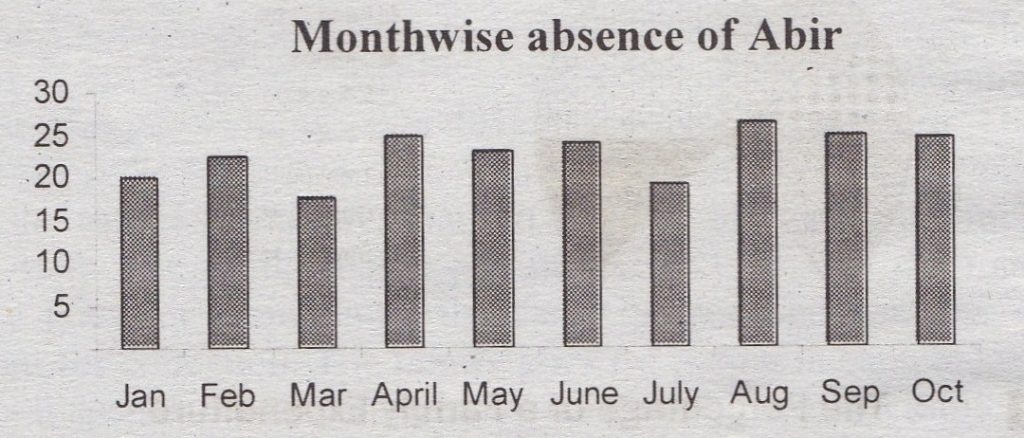
Question: The graph below shows the irregularity of a student named Abir in attending the classes. Describe the chart in 150 words. You should highlight and summaries the information given in the chart.

Abir’s Month Wise Absence from Classes
Answer: The graph shows the irregularity of Abir in attending his classes. It shows Abir’s missing the classes from January through October. It shows how many days in a month Abir keeps himself absent from school. At a glance, it is found that Abir’s missing the number of classes vary from one month to another. Thus, in some months his absence is more than the others. If we take an account of his missing days we find this: In January 20 days, in February 22 days, in March 18 days, in April 24 days, in May 24 days, in June 25 days, in July 19 days, in August 26 days, in September 25 days and iii-October 24 days. Now it becomes clear that the highest number of days he remains absent is in the month August and the lowest number of days he remains absent is in the month of March. Therefore, the number of absent days in other months revolves between 19 and 25 days.

