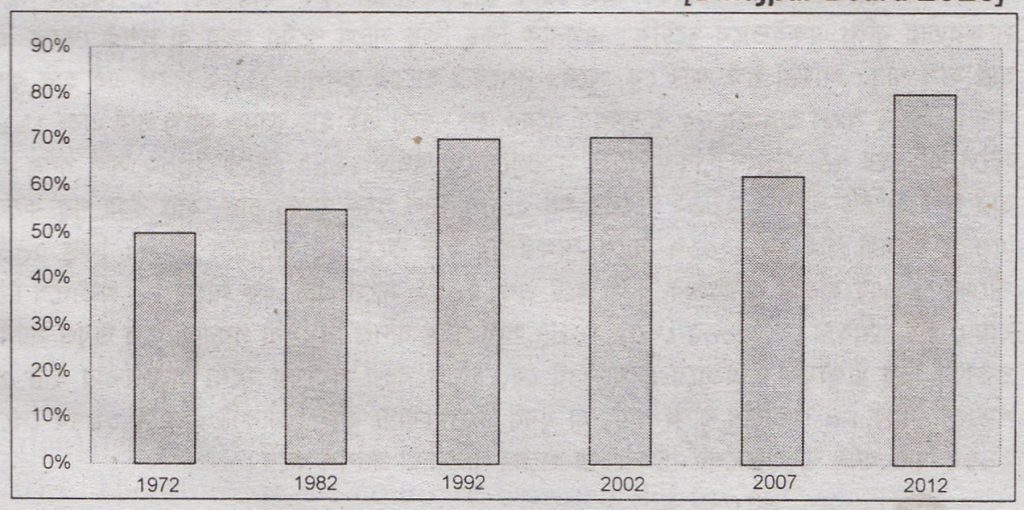
Question: The graph below shows the literacy rate of Bangladesh in different years. Now describe the information available in the graph in your own words: —

Literacy Rate of Bangladesh
Answer: The graph shows the literacy rate of Bangladesh over the years between 1972 and 2012. At a glance, the graph shows that there has been significant growth in literacy over the period. In 1972, the rate of literacy was only 50%. Within a span of fourth years, that is in 2012 the rate becomes 80%. However, in the graph, we notice that the growth of literacy over the period does not occur steadily. Even in some years, the rate falls from the previous. years or decades. We notice that in 1982 the rate has an increase compared to its previous decade rate. In 1982 the rate becomes 55%. In the next ten years, there is a further increase in the rate and in 1992 it becomes 70%. But in the next years, that is from 1992 to 2002 the rate remains unchanged. After 2002 the literacy rate begins to decrease up till 2007. Thus, we find that in 2007 the literacy rate decreases to 62%. But after 2007 the rate has a sharp growth, and in 2012 it jumps to 80%. It is clear that though there is a decreasing trend between the years 2002 and 2007, the overall trend is on the increase. Thus, it is found that within a span of fourth years the literacy rate increases from 50% to 80% which is a very significant growth. Thus, the graph shows the trend of literacy rate in Bangladesh from 1972 till 2012.

