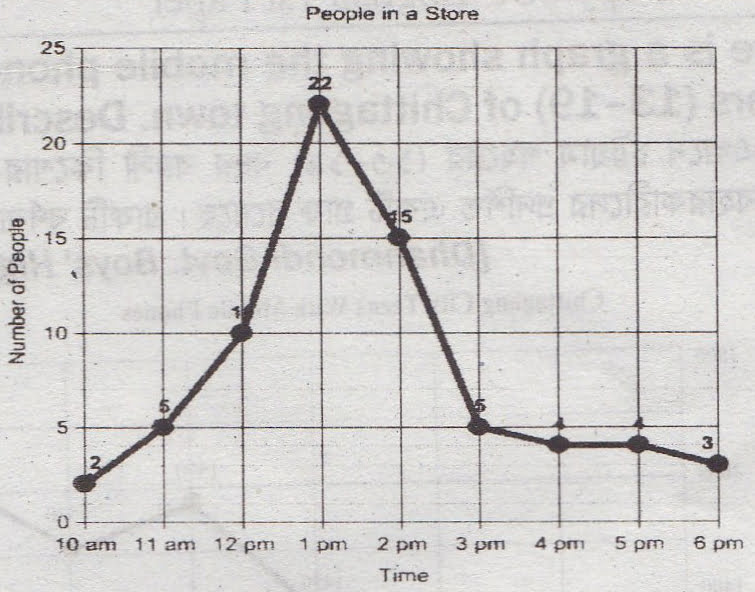
Question: The graph below shows the customers at a departmental store at various hours of the day. Now, write a paragraph based on the graph:

Customers at a Departmental Store
Answer: The line graph shows the business of the day in a departmental store. It shows how the number of customers increases or decreases at various hours of the day. The busiest time in the store is 1 pm. when the number of customers is 22, the highest number in the day’s business. The graph shows its opening hour which is 10 am. At this hour the number of customers is only 2. Gradually the number increases to 1 pm. At 11 am there are 5 customers, at 12 pm the number is 10 and at 1 pm the number is 22. After I pm the number of customers begins to decrease. At 2 pm it is 15 and at 4prn it is only 4. The number of customers remains the same, that is, 4 at 5 pm. From the graph, it is also understood that at some other hours of the day there is more or less the same number of customers. For example, there are 10 customers at 12 pm and at about 2.30 pm. Again, there are 15 customers at about 2-pm and 12.30 pm. There are 3 customers at 6 pm, and it is the closing time of the store.

